Thank you!
Your blog has been successfully shared.
Let's Talk !  954 342 5676
  +44 137 243 2466
If you’ve ever chased a production issue at 2 a.m., you know how one silent metric can trigger a full-blown fire drill. That’s why Datadog monitors exist — to turn floods of telemetry into meaningful signals your team can actually act on.
Done right, they spot trouble before it hits users. Done wrong, they drown your teams in noise.
So how do you make Datadog work for your business, not against it?
Let’s break down how to set up smarter monitors, keep your data honest, and build an observability stack that drives real performance.
Modern observability isn’t about watching dashboards — it’s about foresight.
According to Datadog’s 2024 State of DevOps Report, elite engineering teams deploy 208× faster and recover from incidents 106× quicker than average ones.
The common thread? Tight feedback loops, predictive alerting, and connected telemetry.
When every metric, trace, and log works together, teams don’t just react to outages — they predict them.
That’s the competitive edge observability delivers.
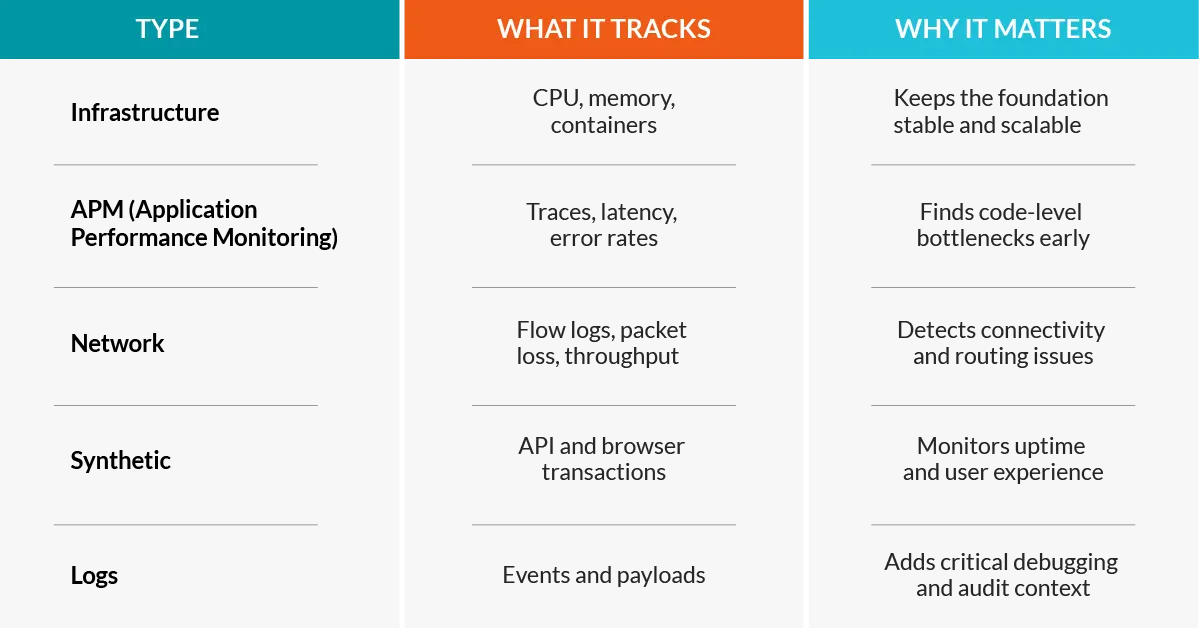
Each Datadog monitoring type offers a unique view of system health. Used together, they give you the full picture.
Installing a Datadog agent is the easy part.
Knowing what and why you’re monitoring — that’s where the strategy lives.
Start with what drives revenue or customer experience: checkout flows, APIs, and high-traffic endpoints.
Define clear baselines for “healthy” (CPU < 70 %, latency < 300 ms) and align your alerts around those metrics.
Then simplify. Datadog found that teams trimming redundant alerts improved response times by 35 % and cut false positives by 40 %.
Focus on the most business-critical workflows first.
Add tags that reflect ownership and environment (team:frontend, env:prod).
Document why each alert exists — and when it should trigger.
Most performance issues aren’t on the server — they’re in the code.
Datadog’s Application Performance Monitoring (APM) traces every request end-to-end, revealing slow database queries, inefficient APIs, and hidden dependencies that clog performance.
Auto-instrumentation gives quick visibility, while manual spans capture custom KPIs. Within minutes, service maps and flame graphs start pinpointing latency hotspots.
Forrester estimates that teams using full-stack tracing reduce troubleshooting time by 45 %. That’s not just faster recovery — that’s regained innovation time.
Sometimes your app is fine — the network isn’t.
Datadog Network Performance Monitoring (NPM) surfaces packet loss, throughput drops, and cross-region latency that quietly degrade user experience.
By correlating flow logs, SNMP data, and VPC telemetry, you can catch network regressions before customers even notice.
Its real power comes from integration.
NPM connects with APM traces and logs, giving full-stack visibility — from a user click to the final backend response.
When every layer communicates, so does your entire organization.
Alert fatigue is real. When every minor fluctuation pings your team, they start tuning out — and critical incidents slip by.
The solution isn’t more alerts; it’s smarter ones.
Tie alerts to KPIs — Only monitor what truly impacts your users or revenue.
Use anomaly detection — Let Datadog learn “normal” behavior and flag real deviations.
Combine signals — Pair latency with error rate to catch only meaningful incidents.
Datadog data shows that teams using composite alerts and anomaly detection cut false positives by nearly 50 %.
Less noise. More focus. Better nights’ sleep.
Great monitoring isn’t “set it and forget it.” It’s maintenance in motion.
Schedule maintenance windows during releases, audit old monitors quarterly, and route alerts using tags for region, service, or ownership.
Then automate what you can.
With Terraform or Datadog’s API, you can manage monitors at scale, enforce naming conventions, and eliminate human error.
Think of it as version control for your observability stack.
Monitoring is a living system — it grows as you grow.
The more your infrastructure evolves, the smarter your monitors should become.
Even the best setups sometimes misbehave — missing metrics, lagging dashboards, or silent alerts.
Before panicking, check the basics:
Is the Datadog agent running and authorized?
Are your credentials valid?
Do your tags match your queries?
Nine times out of ten, it’s configuration — not catastrophe.
If dashboards start slowing down, high-cardinality metrics might be the culprit. Aggregate or roll up what you can to save both cost and clarity.
A healthy monitoring practice means staying curious, not frantic.
Observability used to mean reacting to failures.
Now, it’s about predicting them.
Datadog is already weaving AI-driven anomaly detection and predictive analytics into its platform — tools that learn normal behavior and spot irregularities before they cause downtime. The next frontier is self-healing systems that respond automatically, scaling resources or rerouting workloads without human intervention.
Getting there starts with the way you structure your monitors today — clean data, connected signals, and consistent logic.
Tomorrow’s most reliable systems will belong to the teams who can see issues coming long before they arrive.
Chetu is a Certified Datadog Consulting Partner more than 25 years of custom engineering expertise.
Our teams help enterprises:
Disclaimer:
This content has been made available for information purposes only. Views and opinions expressed in this content are those of the individual author only and do not necessarily represent the opinions and views of Chetu. Chetu, and its representatives, make no representation or warranty of any kind, express or implied, regarding the accuracy, adequacy, validity, reliability, availability, or completeness of any information of this content. Under no circumstances shall Chetu, or its representatives, have any liability to you or any loss or damage of any kind incurred as a result of the use of this content or reliance on any information provided in this content. Your use of this website and your reliance on any information on this content is solely at your own risk.
About Chetu:
Founded in 2000, Chetu empowers businesses with AI and digital transformation solutions, supporting startups, SMBs, and Fortune 5000 companies. We deliver end-to-end software solutions backed by global digital intelligence and industry expertise. Our customized software delivery model and one-stop-shop approach span the full technology spectrum. Headquartered in Sunrise, Florida, Chetu operates 13 locations across the U.S., Europe, and Asia.
See more at: Chetu Blogs
Share


Limited Time Offer for a Free E-Book
Privacy Policy | Legal Policy | Careers | Sitemap | Referral | Contact Us
Copyright © 2000- 2026 Chetu Inc. All Rights Reserved.